If you’re seeing website traffic but no sales, the issue is rarely the volume of visits. It’s almost always trust, relevance, or friction in your funnel. This guide shows you what’s breaking, how to diagnose it quickly, and which fixes produce the fastest lift.
Most sites that get visitors yet fail to convert have a few hidden friction points. This guide explains why it happens, how to pinpoint the issue quickly, and which fixes move the needle first. Website redesign that converts can implement many of the tactics below for you, and our results our clients see show the results these fixes produce in the real world.
Quick Answer
If your analytics show solid sessions but weak purchases, the causes usually fall into four buckets: traffic quality, trust and relevance, offer fit, or friction in the journey. Validate each with data, then apply the targeted fix. Focus on trust signals, product clarity, and checkout ease for the fastest wins.
Table 1: Fast Diagnosis Cheat Sheet
| Symptom you see | Metric to check | What it signals | First fix to try |
| High sessions, low product views | Landing page CTR to PDP | Mismatch between ad promise and page | Tighten hero copy to match ad intent, add scannable benefits above the fold |
| Many product views, few add-to-carts | ATC rate | Offer or relevance gap | Clarify value, add price anchors, show social proof near CTA |
| Carts created, few checkouts | Checkout start rate | Friction or surprise costs | Reduce fields, reveal shipping early, provide guest checkout |
| Checkouts started, low completion | Checkout completion rate | Anxiety or payment issues | Add trust badges, multiple payment methods, guarantee copy |
| Strong organic, poorly paid conversion | Conversion by source | Traffic quality mismatch | Refine ad audiences and keywords, update pre-sell pages |
Why You Get Traffic Without Sales
1. Traffic quality does not match purchase intent
You may have scale from broad keywords, social virality, or Display, but the visitors are in research mode. They click, skim, bounce. Fixing this means either sharpening targeting or inserting a pre-sell step that earns intent.
2. Trust gaps and credibility leakage
Shoppers scrutinize small signals. Inconsistent visuals, vague returns, no real testimonials, or weak contact details all chip away at confidence. See our deep dive on eliminating red flags in the website trust issues guide.
3. Offer clarity and product fit
Even great products stall if benefits are fuzzy, pricing lacks context, or variants confuse. Anchor your price, name the win in plain language, and remove doubts with comparisons and FAQs right on the page.
4. UX friction and invisible speed costs
Slow perceived load, hidden shipping, coupon traps, or account-only checkout kill momentum. Streamlining the journey typically raises conversion fastest.
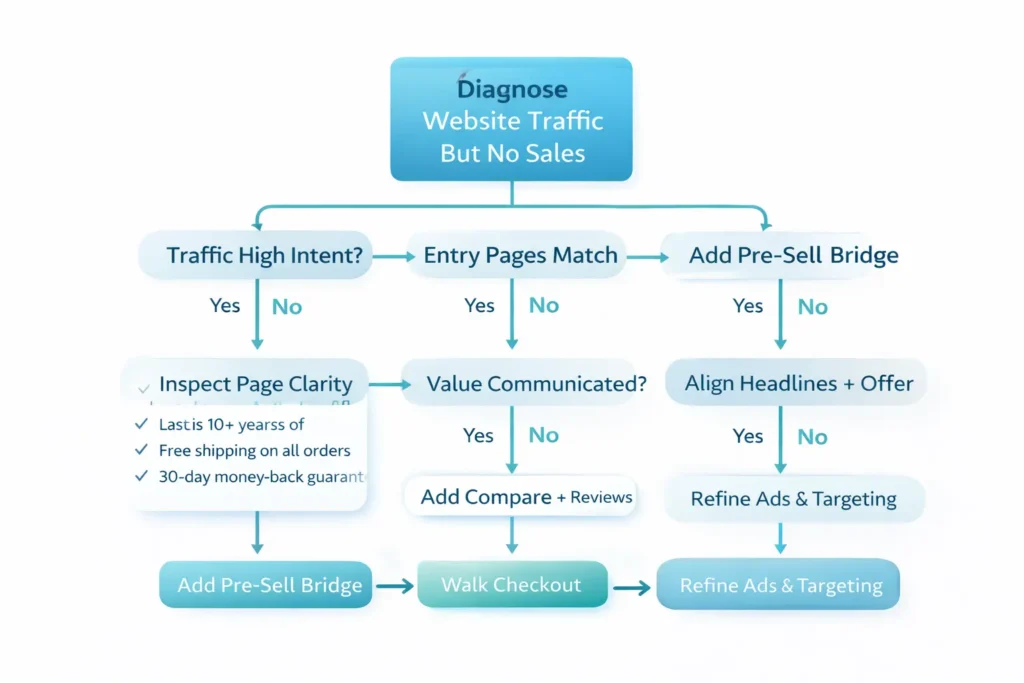
How To Diagnose It Step by Step
Work through this sequence once. It turns guesswork into crisp, prioritized fixes.
Step 1: Establish a clean baseline
- Time box a 14-day window with consistent campaigns and no major site changes.
- Ensure your purchase event tracks server-side or with redundant client events so you trust the numbers.
- Segment by device, source, and landing page. That segmentation reveals the leverage.
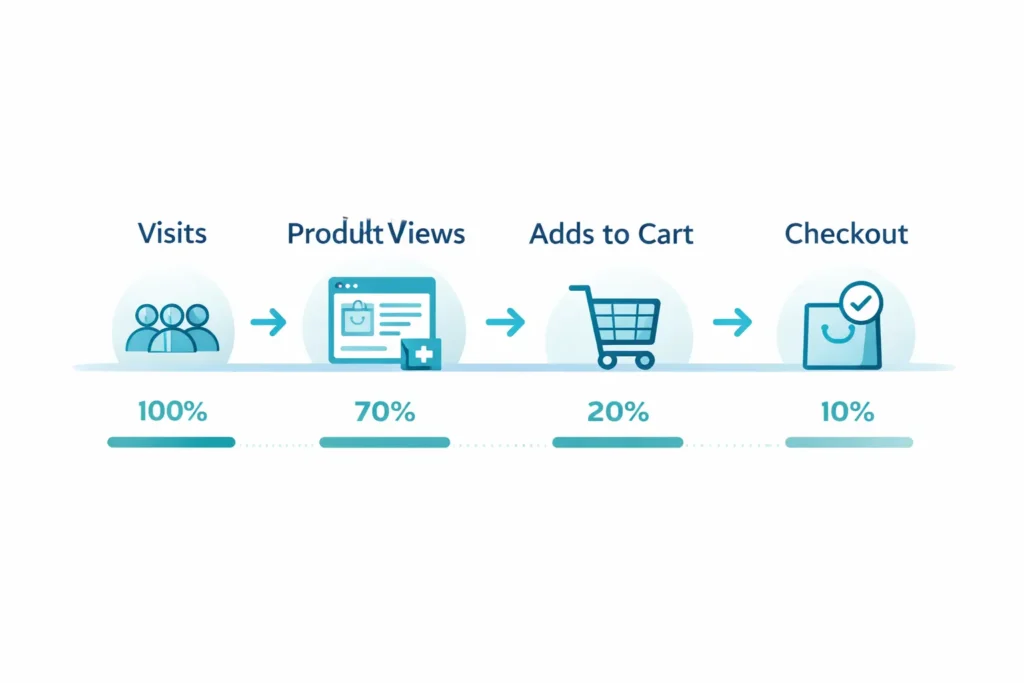
Step 2: Map the funnel fully
Build a simple path: Sessions → Product View → Add to Cart → Begin Checkout → Purchase. Capture the rate and drop-off at each step, per source and device. The biggest gap directs the fix.
Step 3: Read intent from entry points
- Search ads or SEO category pages usually reflect higher intent.
- Social traffic often needs pre-sell content to create intent.
Match your headline and first screen to the promise that got the click.
Step 4: Inspect the first screen
Above the fold, answer three questions within five seconds: What is it, why is it better, and what do I do next. Use an A/B hero that contrasts benefit-led clarity vs aesthetic-led hero. Winner stays.
Step 5: Validate trust signals
Look for these essentials on every commercial page:
- Clear returns and shipping policy close to the price.
- Real customer proof with names or photos, not generic quotes.
- Visible contact path and business info.
If you are unsure where to start, benchmark your page against industry guidelines from independent UX research and checkout studies like Baymard’s work on ecommerce friction, then apply the highest impact patterns first. See a concise overview of common checkout blockers here from Baymard Institute and UX guidance from Nielsen Norman Group for scannable content and credibility patterns.
Step 6: Walk the checkout
- Offer guest checkout.
- Reduce fields to essentials.
- Support popular wallets and local payments.
- Preview shipping costs early to avoid final-step abandonment.
Use tag-based recording and anonymized session replays to spot stalls or errors.
Which Fix Applies To Your Situation
Choose the scenario that matches your analytics. Each includes a specific play that is fast to deploy and easy to measure.
Scenario A: High traffic, low product views
Diagnosis: Entry pages do not align with intent, or the hero is unclear.
Fix: Rewrite the first 100 words to mirror the exact search or ad promise. Place three value bullets near the primary CTA. Add a comparison row vs the common alternative.
Scenario B: Many product views, weak add-to-cart
Diagnosis: Value is muddy, or risk feels high.
Fix: Put your strongest testimonial and a concise guarantee adjacent to the CTA. Add a price anchor by showing comparable options or a per-use cost breakdown.
Scenario C: Strong add-to-cart, poor checkout starts
Diagnosis: Hidden costs or commitment anxiety.
Fix: Reveal shipping estimates on PDP and in cart. Add a delivery date estimator. Provide guest checkout and wallet pay in the first step.
Scenario D: Checkout starts, low completion
Diagnosis: Form friction or payment doubt.
Fix: Collapse optional fields, show security messaging, and display payment logos. Add an inline support link or live chat.
Scenario E: Paid converts poorly, organic converts fine
Diagnosis: Audience or keyword mismatch.
Fix: Split campaigns by intent layers. Use exact match for bottom-funnel keywords, and send cold audiences to a pre-sell guide that warms them up before the store.
Table 2: Source-to-Fix Matrix
| Source | Typical issue | Signal in data | Fastest fix | How to measure impact |
| Paid Search | Broad intent mix | High bounce on generic terms | Break out exact match, tighten ad copy to product language | CVR by query group, Quality Score changes |
| Paid Social | Low buying intent | High PDP time, low ATC | Add a pre-sell landing with problem-solution and proof | ATC rate delta for social traffic |
| Organic | UX friction | Healthy engagement, low checkout starts | Trim fields, reveal shipping early | Checkout start rate and completion rate |
| Referral | Trust mismatch | New users hover on policy pages | Elevate guarantees and reviews above the fold | Click depth to policy pages, conversion lift |
| Offer fit | High click-through, low purchase | Align email promise with PDP content | Purchase rate per campaign |
Practical Examples You Can Ship This Week
1. Shipping clarity that sells
Show expected delivery dates on PDP and cart using real lead times plus location detection. Pair with a simple return policy summary near the price. Many stores see immediate decreases in cart abandonment once uncertainty about timing disappears.
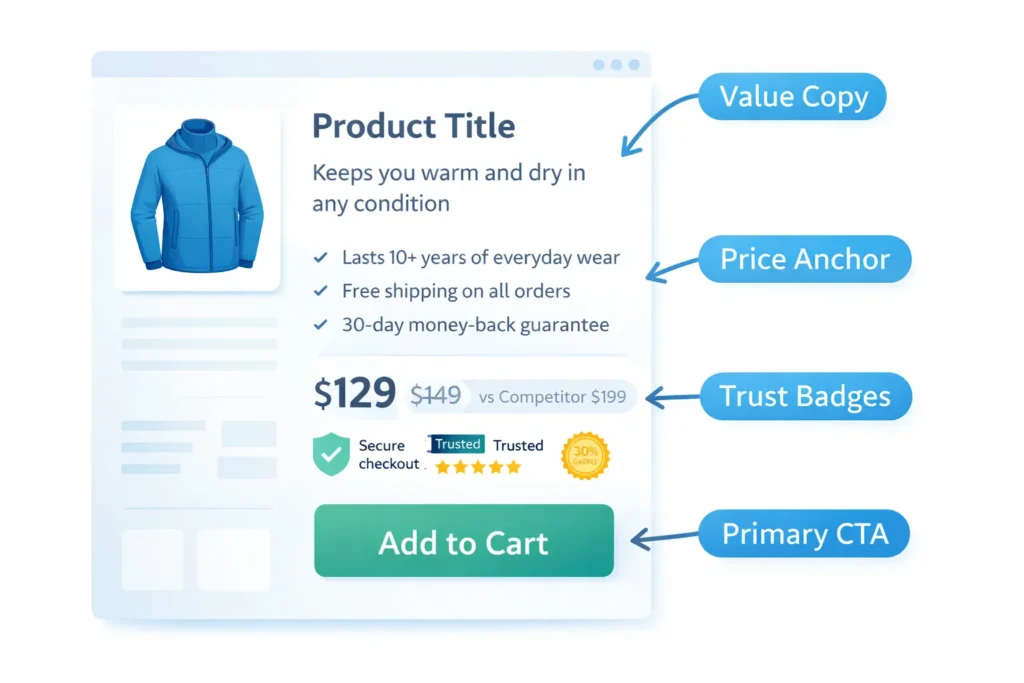
2. The value sandwich around your CTA
Place three concise benefit bullets above the button and two credibility cues below it. Example bullets: Made to last 10 years, Free 30 day returns, Ships in 24 hours. Example credibility: 1,500+ verified reviews, Assembled in-country.
3. Reduce cognitive load on long PDPs
Add a sticky mini-nav with Overview, Details, Reviews, Shipping, and FAQ. People scroll a lot on mobile. Anchors let them jump to the answer and back to the CTA without friction.
4. Use price framing instead of discounts
If your product saves customers time or consumables, translate that into dollars per month or dollars per use. Pair with a comparison table vs the default alternative. Price becomes a narrative, not a number.
5. Add social proof where hesitation peaks
Place a short testimonial or star summary next to the price and again in the cart. Proof at the moment of decision calms last-mile anxiety.
6. Warm up cold traffic with an intent bridge
Create a helpful pre-sell page that addresses pains and outcomes before linking to your PDP. Our article on why my website is not converting shows how intent gaps stall sales and how to close them with narrative content.
Bring In Reinforcements When It Matters
If you want experienced eyes and hands on the problem, book website design & development services and let specialists implement testing, copy, and UX changes. To see proof first, browse portfolio highlights and mirror the winning patterns on your site.
Analytics Setup That Makes All This Easier
- Track product impressions and clicks so you can see where discovery fails.
- Fire add-to-cart on both button click and successful add.
- Split server-side and client-side purchase events to avoid ad-block loss.
- Create segments for first-time vs returning buyers.
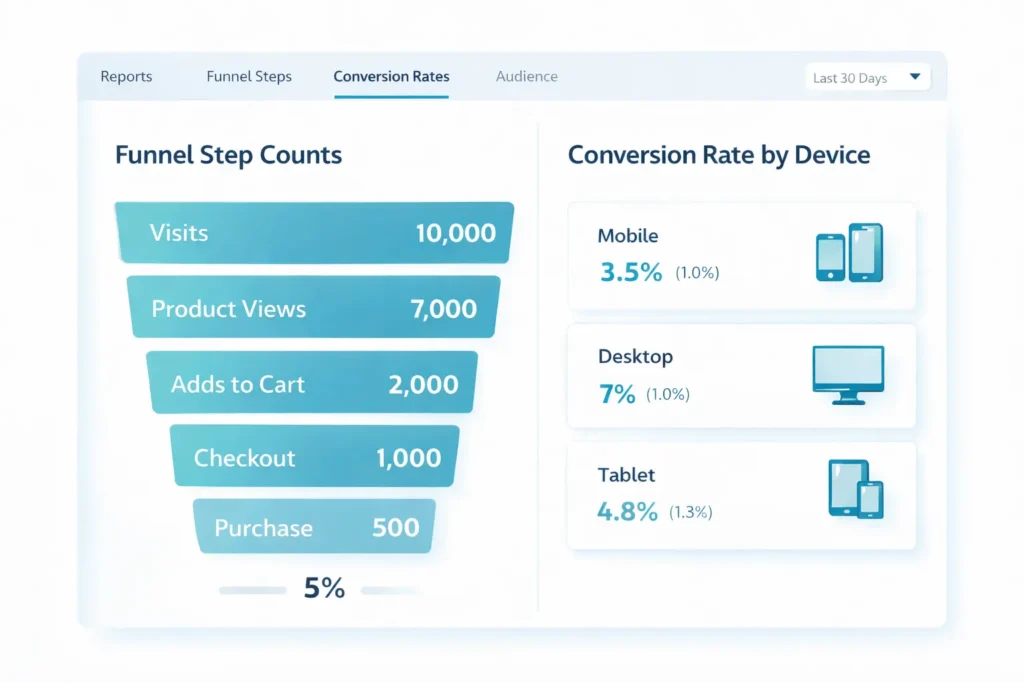
- Set up a simple funnel report with step counts and rates.
For deeper guidance on measurement quality and report definitions, review best practices from Google Analytics Help and check out the UX patterns cataloged by Baymard Institute. This ensures your fixes are measured against stable, trustworthy metrics.
Troubleshooting By Device
- Mobile
Prioritize thumb-reach CTAs, legible 16 px minimum body text, and compressed images for speed. Use accordions for dense content and a sticky add-to-cart bar. - Desktop
Use comparison tables and side-by-side images. Keep critical info above the fold while supporting details sit just below. - Tablet
Hybrid layout. Validate tap targets and ensure hover dependencies are removed.
Messaging Examples You Can Lift
Hero rewrite template:
Headline: Solve [customer pain] in [timeframe]
Subhead: Get [primary outcome] with [key differentiator]. Free returns. Ships fast.
CTA: Get yours today
Guarantee block:
No-stress 30-day returns. Full refund if it is not for you. Friendly support by chat or email.
Delivery block:
Order by 2 pm for same-day dispatch. Estimated delivery: 3 to 5 business days.
When It Is Not You, It Is The Market
Sometimes demand truly dips or a product category commoditizes. If you validated funnel health yet sales lag, re-evaluate positioning and offer. Add bundles or subscription savings. Test a new hero product that earns attention, then cross-sell your original SKU.
Realistic Timeline and Priorities
- Fix trust and friction on the highest traffic PDP.
- Reveal shipping and add guest checkout.
- Align paid search copy with exact product language.
- Create a pre-sell page for social traffic.
- Test a new hero with stronger problem-solution framing.
Expect early wins from steps 1 and 2 while the remaining steps stack benefits.
Final Word: Choosing What To Do First
Start where the drop-off is largest. If carts do not become checkouts, fix checkout. If product views do not become carts, fix value communication. Keep changes focused, quantify each lift, then roll out to the rest of the site.
To move faster, follow the playbooks in our website trust issues guide and bring our team in through a website redesign that converts.
Wrap Up: Getting Past website traffic but no sales
You can absolutely convert attention into revenue. Diagnose the biggest leak with a simple funnel, strengthen trust, clarify value, and make buying effortless. If website traffic but no sales describes your current state, the path forward is systematic: match intent, remove doubts, and reduce steps. Then measure, learn, and repeat.
FAQs
Why am I getting traffic but no sales?
Most often, the visitors you attract do not have purchase intent, or their intent collapses due to trust and friction. Start by segmenting the conversion rate by source and device to see where intent is weakest. Align landing page messaging with the promise that earned the click, place clear value and proof near the CTA, reveal shipping before checkout, and reduce form fields. Fix the biggest leak first, then iterate.
What is the 2 2 2 rule in sales?
It is a reminder to follow up every 2 days, for 2 weeks, using 2 channels. For e-commerce, that translates to two touchpoints after a cart event: a cart reminder within 2 hours and a follow-up about 48 hours later, split across email and SMS. Keep the first message helpful with delivery timelines, then use a value-driven reminder. Respect opt-out and frequency caps to protect sender reputation.
Why am I not getting any sales on my website?
The most common blockers are a mismatch between traffic intent and product page messaging, missing trust signals, and checkout friction. Verify that your value proposition is explicit above the fold, add credible reviews and a simple guarantee near the price, and enable guest checkout with wallets. Check attribution and tracking so you can trust the data, then test one change at a time to isolate impact.
Why are people visiting my site but not buying?
Visitors abandon when they feel uncertain about value, timing, or safety. Remove uncertainty by showing delivery estimates, return policy highlights, and secure payment logos right where decisions happen. Clarify benefits in plain language and use price framing to make costs feel fair. Finally, shorten the path to purchase by bringing CTAs into thumb reach and removing non-essential steps.